
I used autobench to perform the tests. Basically this is a perl script that sits on top of httperf and will run multiple tests in succession outputting the results to TSV.
First, I launched the SHS demo application listening on host 127.0.0.1 and port 8080, with a pool of 400 serving threads, in quiet mode to reduce log activity to ERROR only:
$ ./bin/shs -H 127.0.0.1 -t 400 -q
Then, on a Linux VM, I ran all the tests against the same robots.txt file:
autobench --single_host --host1 127.0.0.1 \
--port1 8080 \
--uri1 /robots.txt \
--quiet \
--low_rate 20 \
--high_rate 200 \
--rate_step 20 \
--num_call 5 \
--num_conn 600 \
--timeout 5 \
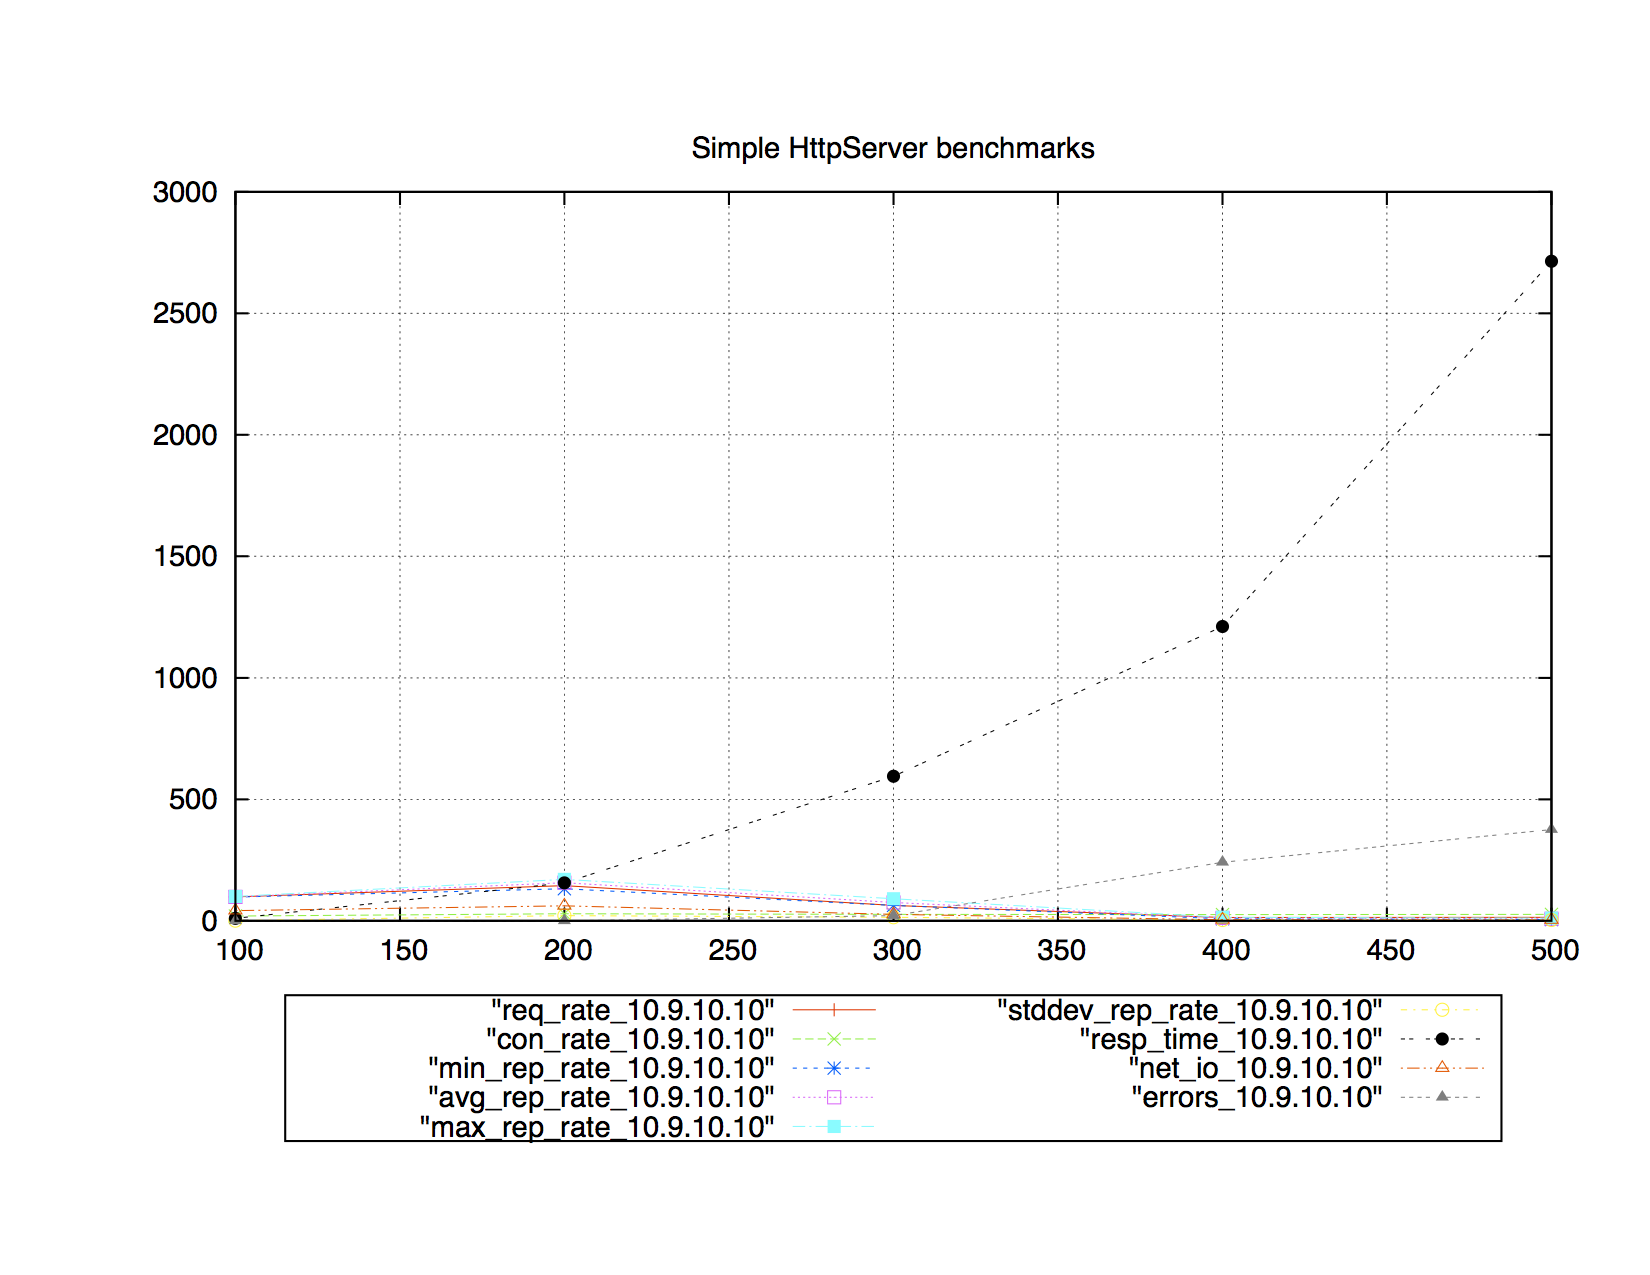
--file shs-benchmarks.tsvwith a series of tests starting at 20 connections per second (with 5 requests per connection), and increasing by 20 connections per second until 200 connections a second are being requested. Each test will comprise a total of 600 connections, and any responses which take longer than 5 seconds to arrive will be counted as errors. The results were saved in the file 'shs-benchmarks.tsv'.
Then, invoking the bench2graph application:
bench2graph shs-benchmarks.tsv shs-benchmarks.ps
I obtained the following graph.
